Recently discussions regarding the use of various software in the study of coordination modeling have happened. All claim to implement the same models along with their own variations or empirical derived models. The model we are most interested in is known as Longley–Rice, or the irregular terrain model (ITM). This model is optimized to cover 20 to 20,000 MHz for predicting signal strength over real terrain when used with a digital elevation model (DEM).
The ITM model in area propagation mode essentially breaks up the underlying map into tiles of a given resolution, and taking account the DEM heights, computes the signal level in a tile and then onto the adjacent tiles and so on using the now attenuated signals from the source area. The original code was written in FORTRAN, converted to C++ and has been re-implemented a number of times to speed it up, improve it and add a given vendors “secret sauce”. The original docs and code may be found on the ITS website. Keeping in mind the ITM model was used to layout FM and most importantly the VHF/UHF Television spectrum in the 1960’s it’s proven to be a reliable model. Land Mobile radio has adopted the same basic concepts in needing to predict interference between co and adjacent channel users, albeit with different criteria than TV broadcasters.
As amateurs push to coordinate frequency use in their spectrum, it’s imperative we understand our tools and what software we may use to predict coverage. This is more important we have repeatable standards which anyone can model and check to keep our coordination bodies honest as well. FASMA has standardized on SignalServer which is a multithreaded version of SPLAT!, both implement the C++ version of the ITM model. Also common in amateur circles is the use of RadioMobile, a non-free application for windows operating systems.
Commercially there are many packages used for radio modeling, and two of the most popular are ComStudy and Pathloss. ComStudy is the de-facto standard used by the LMR coordinators approved by the FCC and implements it’s own proprietary version of the ITM model and ships with an additional land cover database. Pathloss 5 is mostly known in the Part 101 and microwave Point to Point (PtP) modeling space, but has an ITM mode, and unlike most software, describes the algorithm implemented in great detail. As Pathloss doesn’t provide source code, we cannot be sure how faithfully they have implemented the ITM model.
The DEM model data used is the 3 arc second resolution data from the Shuttle Radar Topography Mission (SRTM). This is a digital model of the earth’s elevation in 90×90 meter tiles as a height. This works well for most areas, but there is higher resolution data 1 arc second and even 1/3rd arc-second available for certain areas of the earth. Ultra-high resolution DEM data has national defense implications, and is generally not available. The SRTM data typically includes the tops of trees in forests, which can present a problem if a tower is in a forest. We can say the height above ground is 100 meters, but if the adjacent trees are 20 meters average height, the model AGL should adjusted to 80m (100-20 tree height), or we will be modeling the system 20m too high. This same phenomena can present in dense cities as an urban forest area.
Modeling Criteria
In comparison we have modeled a test repeater with an omni directional antenna as follows:
<font=monospace>
Latitude:        42.33
Longitude:      -87.91
Frequency:      446 MHz
Antenna Height Above Ground: 97.5 meters
ERP:            707 watts
Signal Criteria: 39 dBuV/m (dBu)
Reliability and confidence criteria - (50, 50)
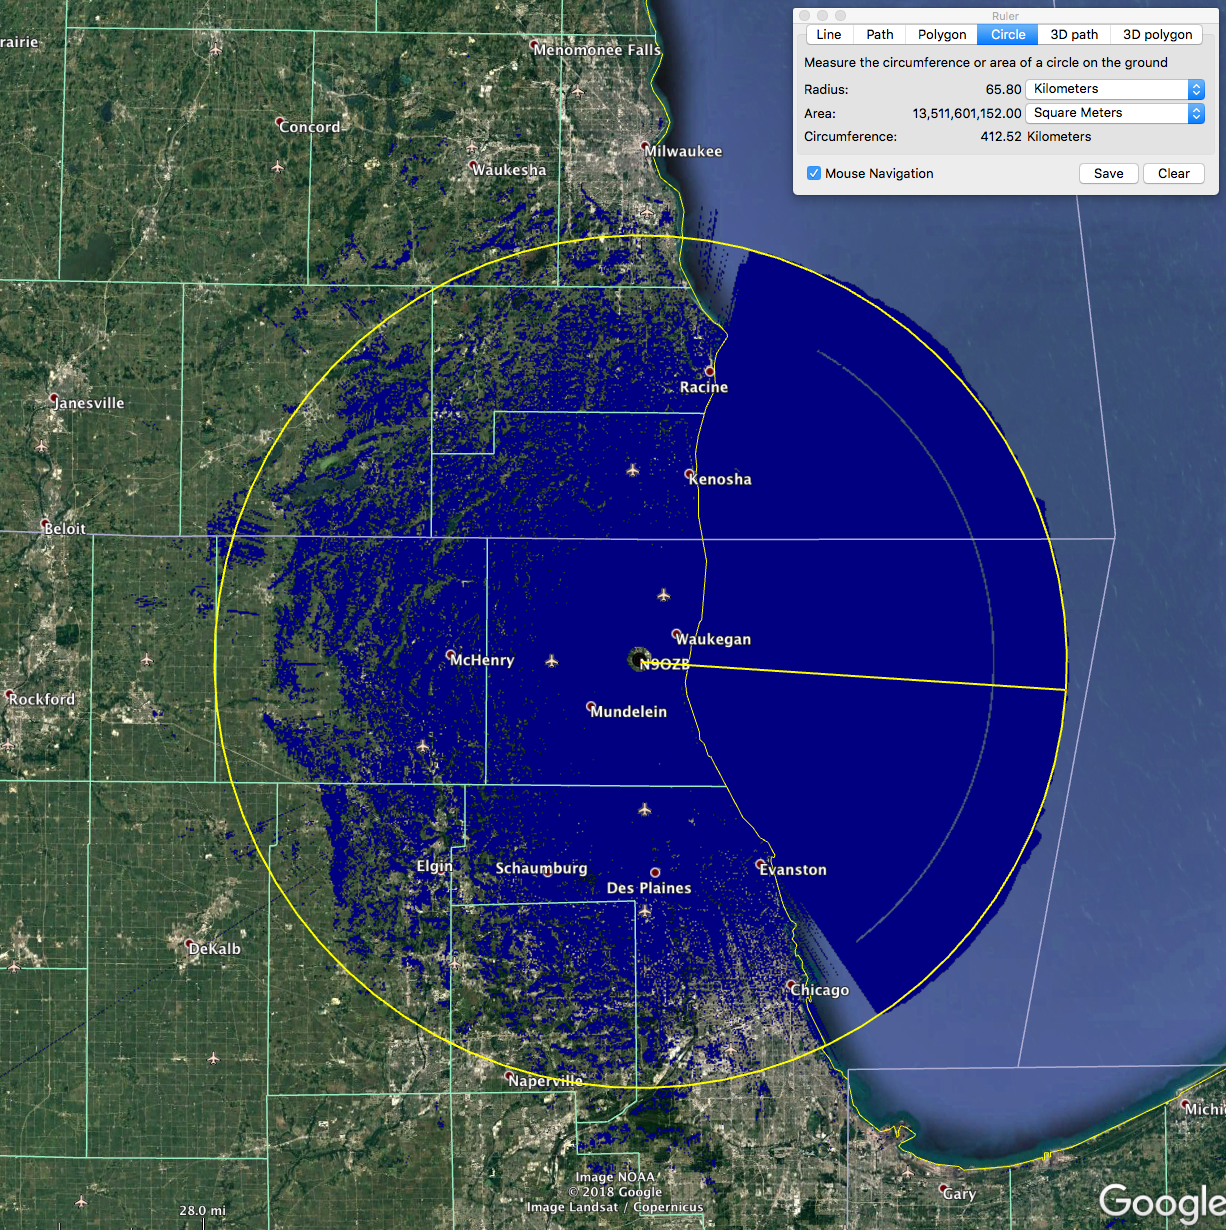
Signal Server
SignalServer was invoked with the following command:
./signal-server-base.sh -lat 42.328889 -lon -87.912500 -txh 97.54 -f 445 -erp 707 -rt 39 -conf 50 -o blueblue | ./genkmz.sh
This produced the plot below with a radius (based over the water) of 62km.
The reason for basing the plot over the water for radius is it should be the same height and signal strength in all models, as there is nothing there.

This plot took about 150 seconds on a quad core computer.
The Keyhole Markup Language file is here, and a version of the same plot, but red is here. The red color version is useful for comparing and contrasting with the other results in the various shades of blue.
RadioMobile
RadioMobile is interesting as its non-Free Software, but doesn’t appear to have a commercial use keeping it from being Free Software. Due to the GUI, it’s popular with a number of amateurs. The configuration for generating plots is quit complex and poorly documented to get a 1:1 ITM model from it. RadioMobile is not multi-threaded, in fact the entire GUI locks up while rendering, however a render is completed on a Dell D830 (a laptop circa 2006) in about 60 seconds. From this we must assume some “speedups” or shortcuts in the code are taken when compared to the ITM reference code.
We followed the FASMA reference guide on modeling in RadioMobile for this plot.
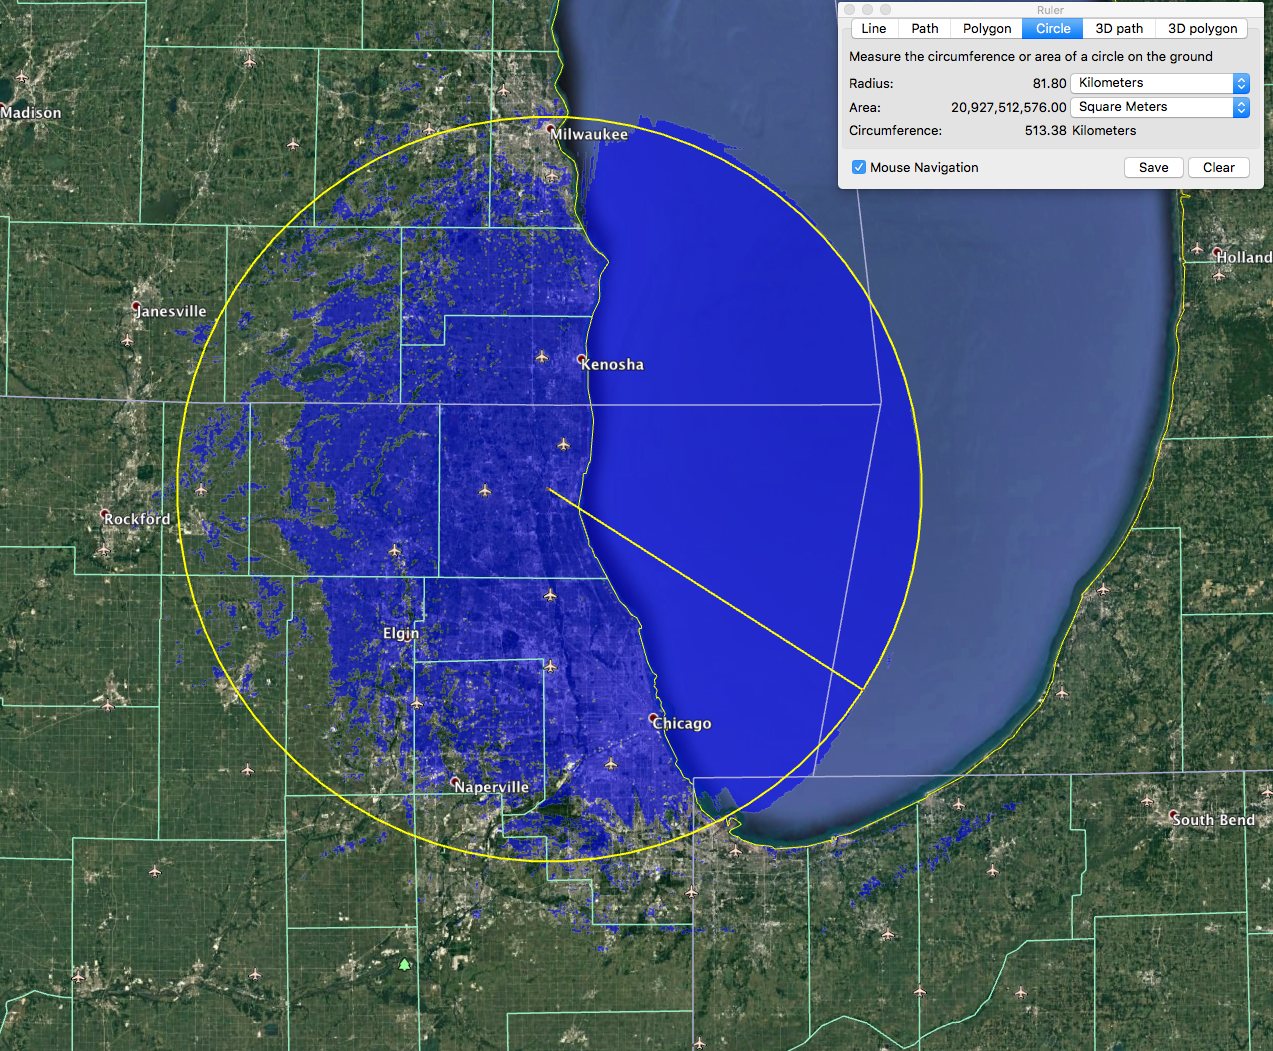
This modeled with an 82km radius over water, and seemed to have greatly overstated coverage compared to the other models.
Pathloss 5.1
Pathloss has no easy way to export the configuration for a model. We had this modeled by a trained professional user of the software. Pathloss in area mode is exceptional slow, there below took about 12 hours to render. We found no multi-threading taking place, and like RadioMobile the GUI locked up during this. Based on this, we can assume the code very close to the ITM reference.
The radius here was 65km and compared very closely with the SignalServer model.
The Keyhole Markup file of this is here.
ComStudy 2.2
ComStudy was run by an experienced engineer who has worked LMR across the VHF and UHF business spectrum. Again there is no easy open way to export the study inputs for ComStudy, but the below files were modeled. We didn’t have exact measurements of time for the generation of the below plots.
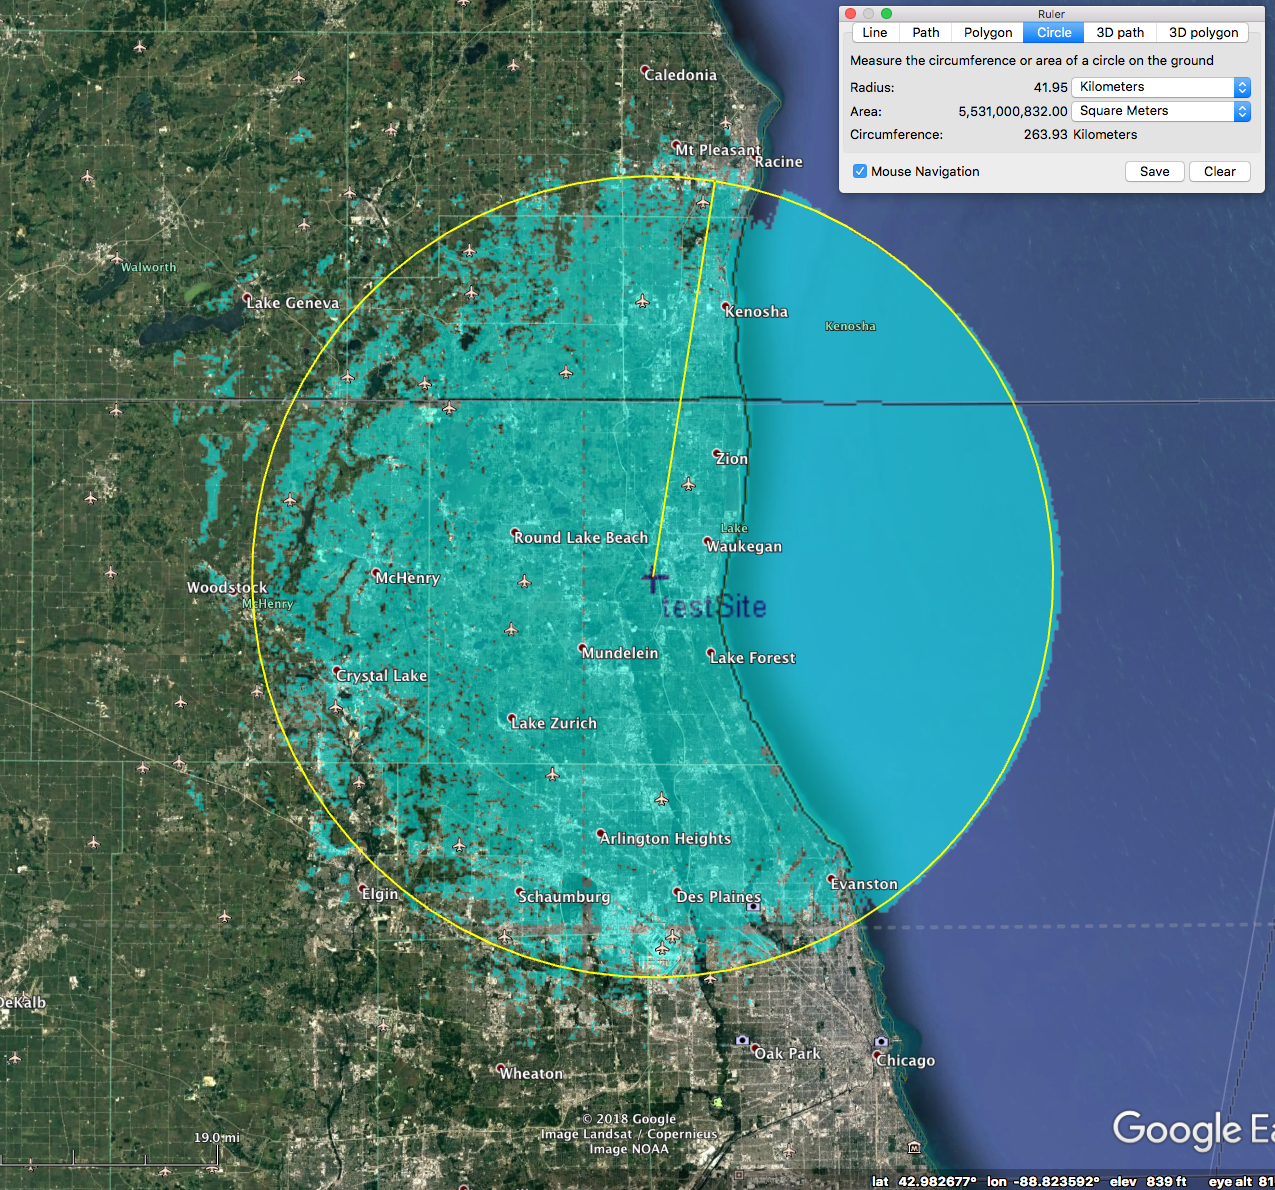
This is a 42km radius and has the smallest area of any model we studied. The Keyhole Markup file is here.
In ComStudy it also has proprietary land-cover databases which ship with it. Much like a DEM file, this identifies the type of cover in a given area, which changes the radio propagation characteristics of that area. We have a model with the LCF enabled and it’s much smaller as well.
Comparisons
SignalServer with PL5
This was the closest comparison, and based on the PathLoss docs, we believe PathLoss has implemented a truthful version ITM algorithm. This would confirm the SignalServer/SPLAT! model as being correct as well, and we belive this confirms it is the case.
In the below, SignalServer is in red and the PathLoss model is in blue.

The slight variation over water (3km) and the open arc in the PathLoss model would indicate it has two ray turned on by default. This only comes into effect over large flat reflective areas such as water. Over land the models align 99%.

Looking at the fringe coverage we see the same tiles, just slightly offset. This may be due to the datum used internally in PathLoss not being corrected to the WGS84 datum of our coordinates. This would further confirm the agreement both SignalServer and PathLoss have a true ITM model implementation.
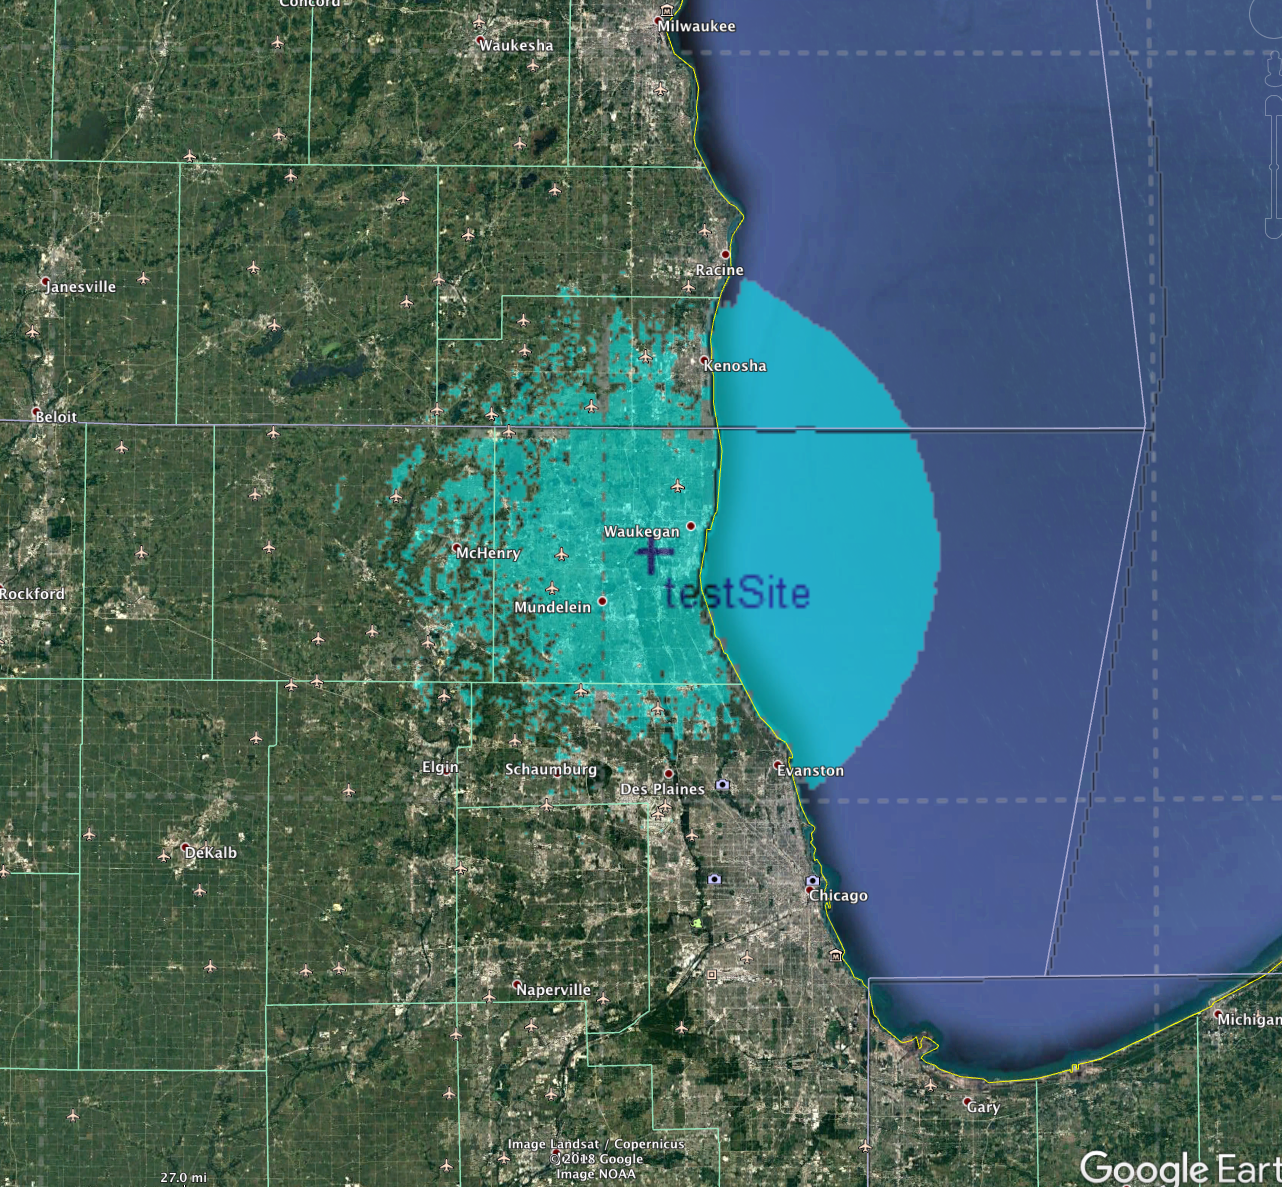
SignalServer with ComStudy
ComStudy claims to implement the same ITM model, however it doesn’t appear to be the same. We’re not certain why this is, perhaps it’s due to some of the speedup code or just a general desire to mix the ITM with an empirical model as they can call it the ComStudy model. ComStudy also may take into account the LCF data for land cover and we have presented that below as well.
ComStudy with a 42km vs 62km radius in SignalServer. ComStudy is the lighter blue color.
We’re not certain why it’s different, but at least in the areas that are covered ComStudy and SignalServer seem to align; looking to the north west above McHenry on the map we can see gaps between the airports and they align in both models. This may be due to the ComStudy using a different height, correcting for antenna gain, or another issue. What we do see is that the models do appear to use the same DEM data to determining a valley or non-coverage area.
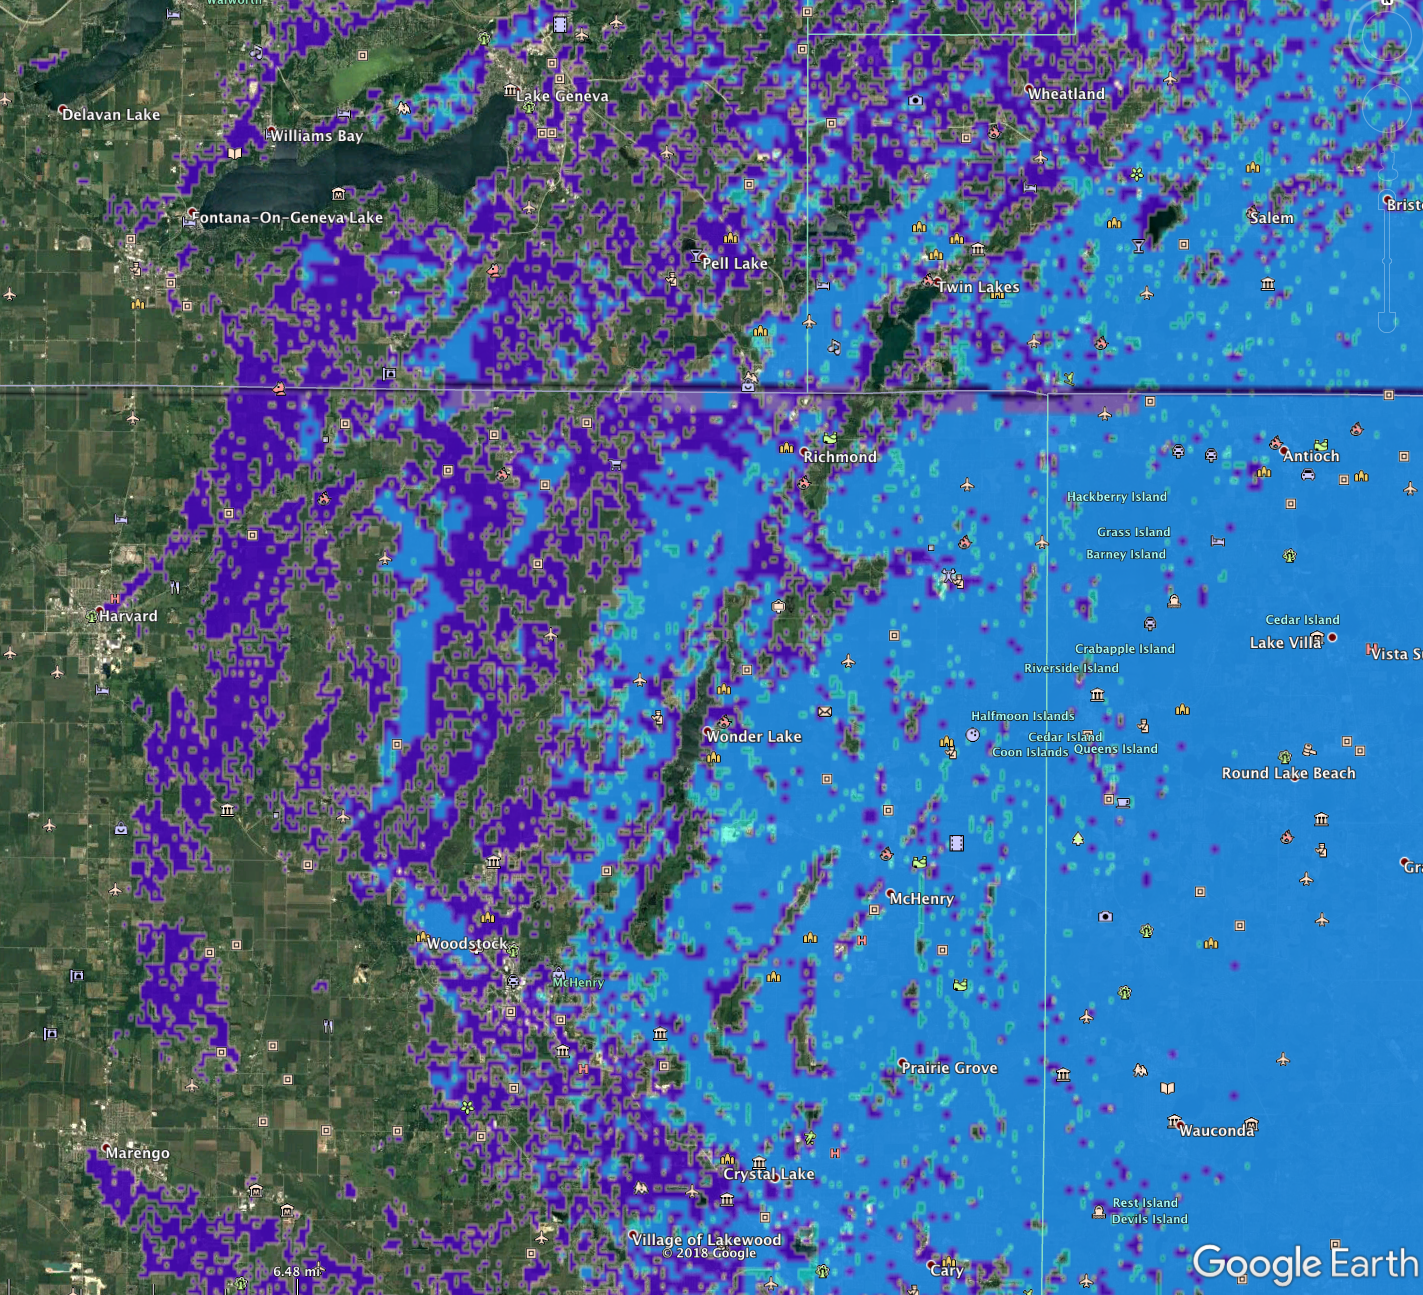
Zoomed area showing the alignment between areas in ComStudy and SignalServer.
This is the overlay of the ComStudy on Signal Server with the land cover data. We can see this LCF data has impacted coverage to the north and south over land. This does give some value to the theory ComStudy may be adjusting the DEM data for forested regions as suspect in the other non-LCF model, and explain some of the descripency between it and SingalServer/Pathloss.
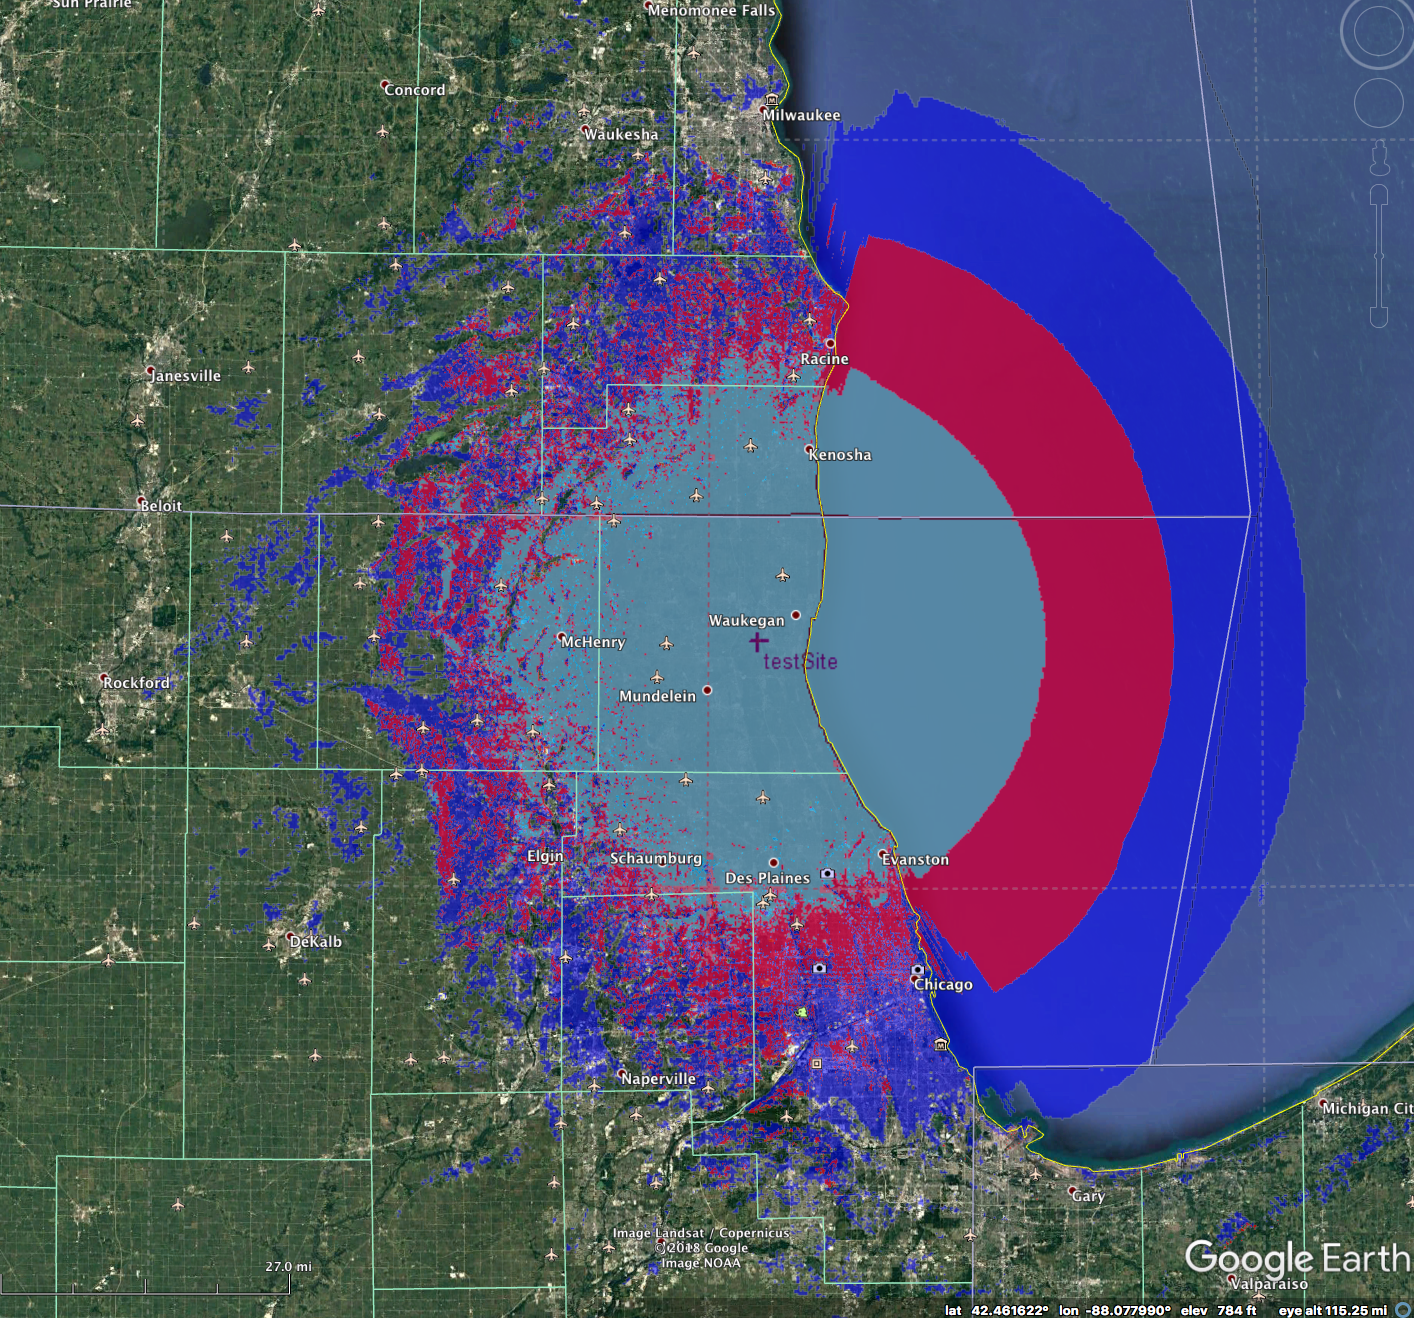
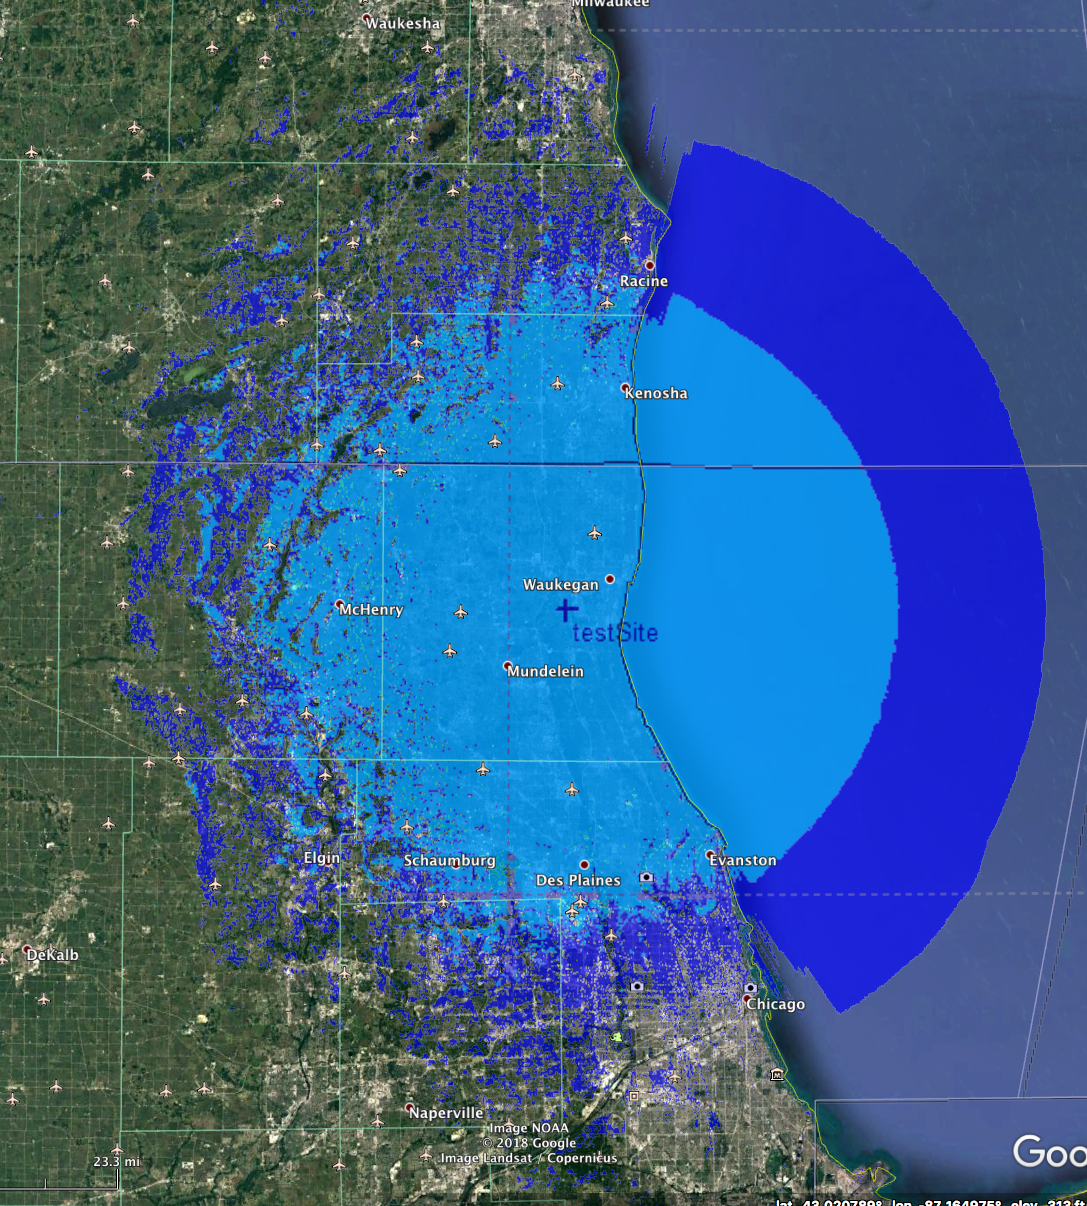
RadioMobile vs. SignalServer
Perhaps in the most interesting study, we found RadioMobile to vastly overstate coverage compared to the other three programs. This may be due to the primary user base of amateurs who are wowed by the enhanced coverage predictions, thus it encourages many users. It may also be the “speed ups” done to allow RadioMobile to so fast. Indeed RadioMobile was the fastest to produce a model of any of the programs tested.
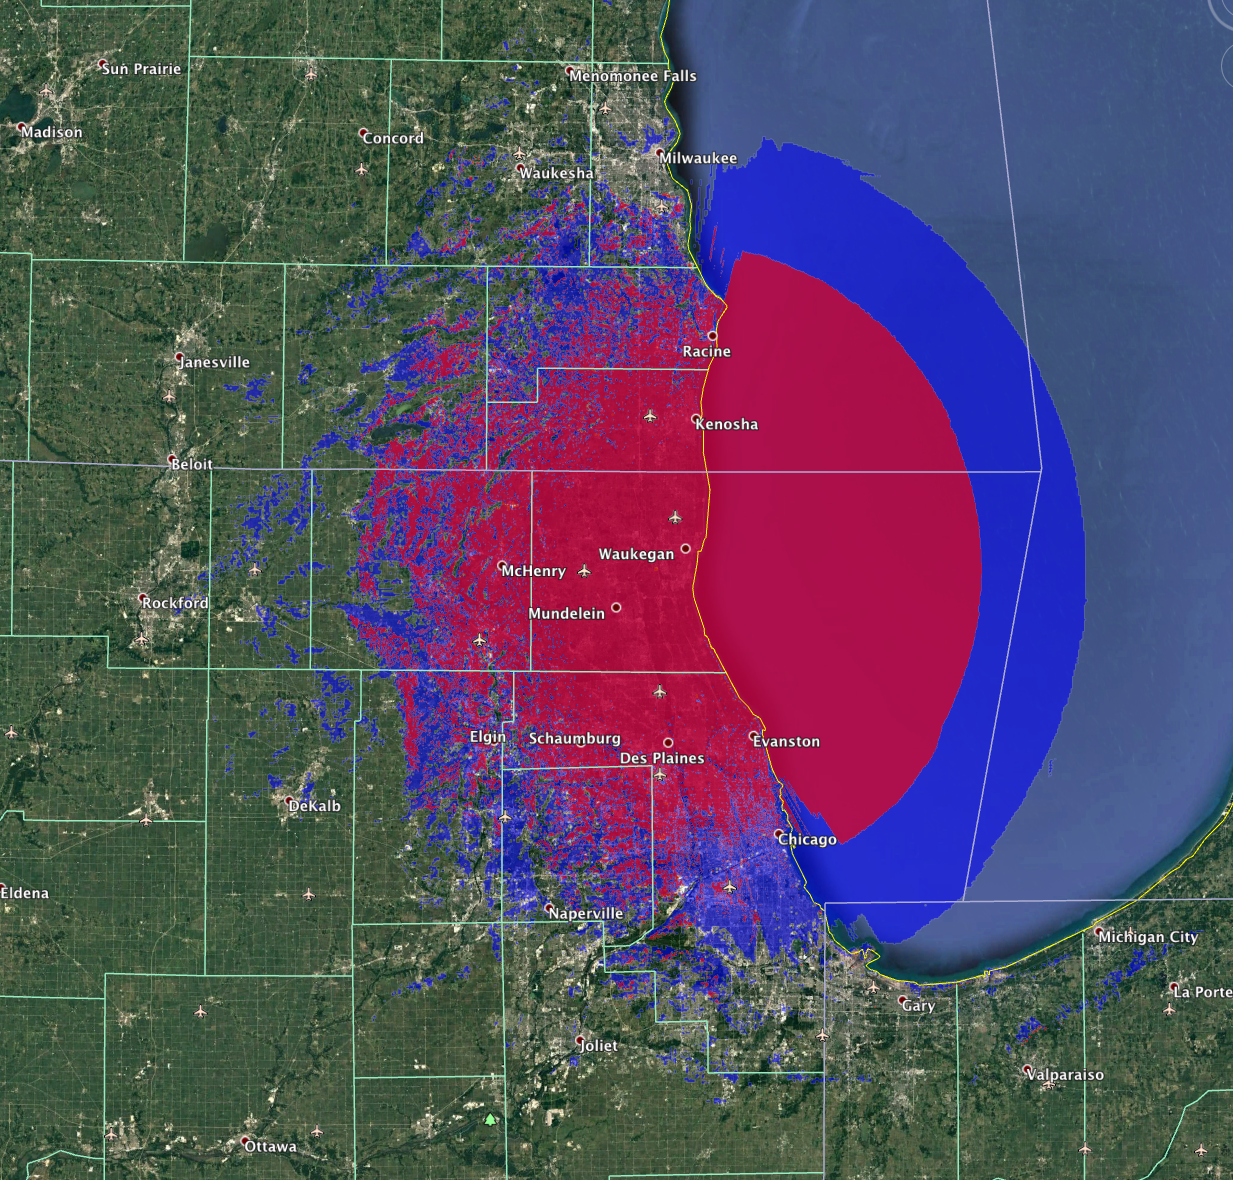
In the above we can see the overstated RadioMobile plot in blue and the SignalServer plot in red.

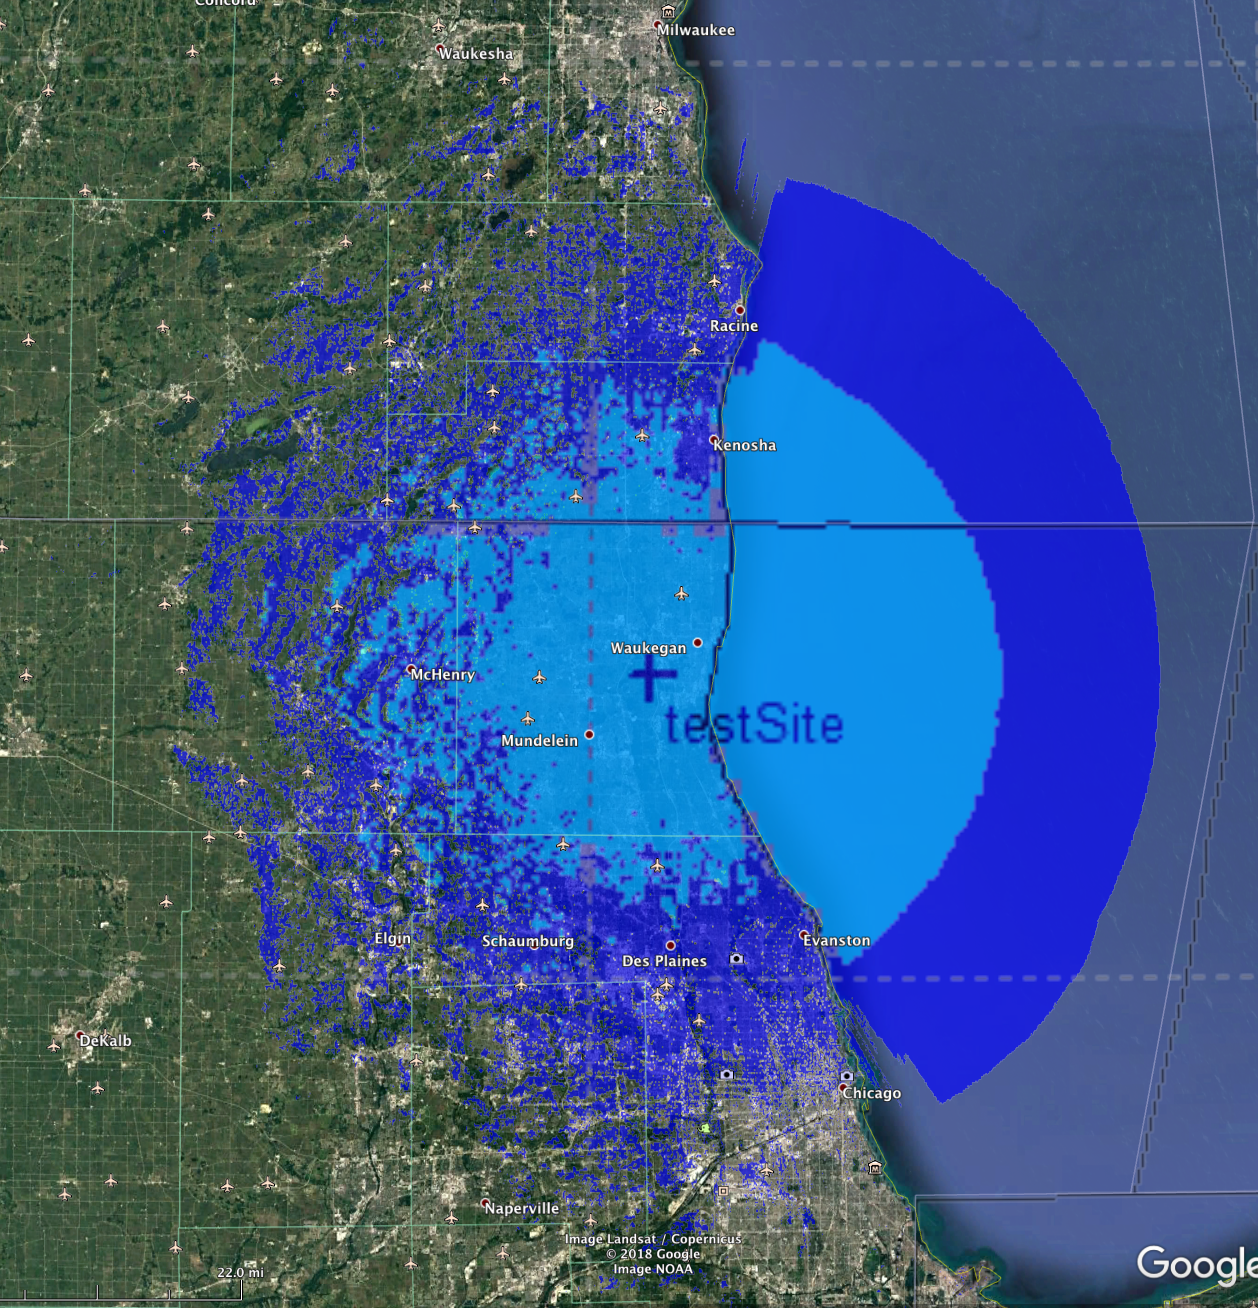
Here we can see the light blue of the ComStudy in the center, red of SignalServer and then the blue of RadioMobile.
We’re not certian why this is with RadioMobile, but have found ~15 dB of reduction of ERP will bring the model to align more with SignalServer and Pathloss. This was not tested in other areas and we caution anyone using RadioMobile (or any non-Free Software) to not trust the results. We cannot recommend using RadioMobile for any real modeling of amateur repeaters due to these issues.
Conclusions
The intent of this research was to compare and validate SignalServer’s ITM model with other popular radio propagation software models. We found a great agreement between SignalServer and Pathloss, confirming a faithful implementation of the ITM model. ComStudy was shown to be slightly less generous with coverage, but where the models did overlap, we found they agreed.
RadioMobile was the outlier, and was found to be greatly overstating a coverage area, and no alignment with even common areas of coverage in SignalServer. Based on this the author cannot suggest the use of RadioMobile.
References
SignalServer 39 dBu model Keyhole Markup File
Signal Server 39dBu red KMZ
ComStudy 2.2 with no landcover
Pathloss 5.0 Study
RadioMobile
ComStudy 2.2 with landcover
SRTM mission overview on wikipedia
Shuttle Radar Topography Mission on the JPL homepage
ITM Model homepage on the Institute for Telecommunications Sciences
SignalServer – Github fork by N9OZB
SPLAT! – Homepage
RadioMobile – Homepage
ComStudy – Homepage
Pathloss – Homepage